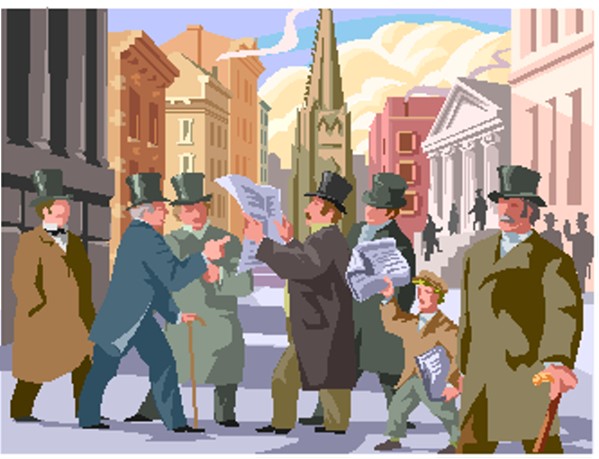
In 1698 John Castaing begins to issue “at this Office in Jonathan’s Coffee house” a list of stock and commodity prices called “The Course of the Exchange and other things”. It is the earliest evidence of organised trading in marketable securities in London. In the same year, Stock Dealers are expelled from the Royal Exchange for rowdiness and start to operate in the streets and coffee houses nearby, in particular in Jonathan’s Coffee House in Change Alley.
In 1720 the wave of speculation fever known as the South Sea Bubble bursts and in 1748 fire sweeps through change alley destroying most of the coffee houses. They are subsequently rebuilt. In 1761 a group of 150 stockbrokers and jobbers form a club at Jonathans to buy and sell shares and in 1773 the brokers erect their own building in Sweeting’s Alley with a dealing room on the ground floor and a coffee room above. Briefly known as “New Jonathans”, members soon change the name to “The Stock Exchange”
The first regional exchanges opened in 1836 in Manchester and Liverpool and in 1845 there was more speculative fever as “Railway mania” sweeps the country.
In 1972 her Majesty the Queen opens the Exchange’s new 26-storey office block with its 23,000 sq ft trading floor and in 1986 deregulation occurs and trading moves from being conducted face-to-face on a market floor to being performed via computer and telephone from separate dealing rooms. This was known as “Big Bang” and it meant the ordinary investor could move in without having to use a broker or middleman for advice.
The fundamentals of investing
When a new company is formed it issues ordinary shares and the price of a single share will be determined by two factors. First, how many shares it is decided to issue and secondly the market value that specialists place on the whole business. Normally this value is fixed by applying a multiple to the current net profit of the business. Often, a big factor in setting the multiple is the sector that the business fits into. For example, banks and insurance companies tend to operate on fairly low multiples whereas information technology and retail businesses are generally higher. Market sentiment plays a part in this. Banks may be seen as old hat, steady but boring whilst a new computer or technology business holds more excitement.
A typical multiple in valuing a company would be 15. So, for example, if the business makes £1m profit a year and 15 million shares are issued then the price of each ordinary share will be set at £1.
Ordinary shares are referred to as equity and because they are not backed by any assets or security of any kind, they represent the risk capital of the company. Many pioneering ventures over the years, such as the building of the railway system in the 1800’s, could not have occurred if ordinary people had not invested in the risk capital of the new railway companies. They risked their money in anticipation of the initial share price rising as operation profits grew.
Equity in a company is the same as in the home that you “own”. What you actually own is the market value of the property less the mortgage attached to it. That equity is always at risk, it could go up but it could also go down.
Many people think that they have no involvement in ordinary shares. This is unlikely to be so. Anyone who has a pension scheme, holds an ISA or has money in a Unit or Investment Trust for example is beholden to a greater or lesser degree to the performance of The Stock Market. It will be indirect, but it exists nevertheless.
The size and structure of The Stock Market
The performance of the stock market is measured by indices. The one most quoted is the FTSE (pronounced footsie) 100. The FTSE is itself a company and is owned jointly by the Financial Times and the London Stock Exchange. It is independent of the market and does not give financial advice.
The FTSE 100 index monitors the movement in the market value of the biggest 100 companies listed on the London exchange. The market value of any company is simply the number of shares issued multiplied by the share price at any time. Whilst each business quoted in the current top 100 is large, individual companies span a huge range of market value. For example the value of the biggest business is close to £100 billion whilst the smallest is about £2.5 billion.
The list of the top 100 companies is not stable. As the value of a company drops (its share price falls) so it is in danger of being demoted, just like in a football league, and similarly the business at the top of division 2 is pushing to take its place as its value increases. Another reason for a company to leave the top table would be if it was taken over by a business quoted on an overseas market or by a private firm.
As regards the lower divisions, there are indices that measure the performance of the top 250 companies below the top 100, the top 350 companies and all the companies taken as a single block. In all, in what is known as the main market, there are some 1,800 different businesses.
To help find a company on the main market, the businesses are grouped by sector. Each such sector describes the principal market of the undertaking. There are 39 such sectors and they appear in the financial press in alphabetical order starting with aerospace and defence and ending with travel and leisure. So, to find a company you first decide what sector its main business is in and follow the alphabetical listing within that sector. For example, Tesco forms part of the “T’s” within the retailers sector and also, because its share price is printed in bold type, it is denoted as being in the FTSE 100 group.
Aside from the 1,800 companies on the main market, there are a further 1,650 businesses of a smaller nature grouped into what is known as the small-cap market. Even this term can mislead since four of these have a market capitalisation of the order of £1billion each. It follows that the choice for a direct investment, in the UK stock market alone, is vast.
Share valuation terminology
There are a number of terms that are used regularly when choosing a share to invest in. Such terms will crop up when discussing different investment strategies.
PE ratio, Price to Earnings is a quick and widely used valuation tool that shows how much the market values a stock compared to its earnings. It is calculated by dividing the share price by the most recent earnings per share figure. Any figure below 15 is generally reckoned to be reasonably cheap
Price to book, Is the measure of a share price compared to its book value. It is calculated by dividing the price of the stock by the latest quarter’s book value per share
PEG, This is the Price to Earnings Growth ratio and is very important to many investors. It was originally made famous by Jim Slater, the very successful investor and financier. It is calculated by dividing the PE ratio by the annual Earnings Per Share (see below) growth. A positive figure below 1 represents good value (Jim Slater actually recommended .75)
Dividend Yield, Is calculated by dividing the annual dividend per share by the share price. It tells you how much a company pays out in dividends compared to its share price. For example, there are companies in the FTSE 100 with yields higher than the best bank deposit accounts.
Earnings Per Share (EPS), Measures a company’s profitability. It is calculated by dividing net profit by the number of average outstanding shares.
Price to cash flow per share, Is a measure of how much the market values a company’s financial strength. It is calculated by dividing the share price by the cash flow per share figure. A multiple lower than 10 is regarded as good.
Whilst there are many other terms in regular use, those listed above are the most common. The serious investor does not rely on tips or bar gossip or even advice from the best of the financial press. Rather he/she takes a favoured measure from the above (or a combination) and makes a value judgement based on published audited accounts. In so doing, that investor will have a strategy underpinning a selection of shares.
Choosing an investment strategy
We now know enough about the stock market and in particular the terminology that is used to turn our attention to investment strategies. An investment strategy is simply an approach to choosing investments. It can also be thought of as an investment style. Different investment strategies reflect investors’ varying objectives, timescales and risk tolerance.
The most common strategy and arguably the most conservative is known as Value Investing and involves looking for companies that are undervalued relative to their present profits or cash flows. Because companies with strong cash flows are also those able to pay high dividends, investors looking for an immediate income tend to use some form of value investing.
The theory of value investing is based on picking shares that have low valuations relative to their current profits, cash flows and dividend yield. The investor is looking for either capital gain or dividends as distinct from one or the other. Pure gain seekers and pure income seekers will be dealt with later.
Value investors look for low valuations on current earnings rather than for higher valuations that may be based upon future growth expectation. The rule will be “low valuation and stable earnings” rather than “higher valuation and growing earnings”. As such, it is unlikely to appeal to those seeking dramatic results in the short term, however there are a number of value investors who have been very successful. There is strong evidence that this strategy is the most successful in the long term. A phrase has been coined to capture this fact “value effect”.
Exactly what measures or “terms” a value investor will employ varies but the more common are PE and Dividend Yield and most successful value investors seem to pay a lot of attention to cash flows. This latter is, theoretically, the most correct approach.
Finally, here is the warning note. There is usually a reason for low valuations. Investors should know why a stock is cheap before buying it. For example, if the PE ratio is very low, there may be a risk of significant deterioration.
A more adventurous investment strategy than Value Investing is known as Momentum Investing.
Momentum investors buy stocks that have “momentum”, in other words they invest in companies that are improving at a faster rate than the market or than the market currently expects. This strategy is based on the expectation that, although the stock price is already high, further good news will push it higher.
Momentum investors also look for average companies or even good companies that are in the process of becoming much better. It is in this transition that momentum investors make money.
Put simply, this maxim applies “buy what is going up, sell what is going down”. It is a strategy that tends to work well at certain times, for example, a sustained “bubble” can make this practice a real winner. It is quite possible to become a momentum investor without really knowing it since there is comfort in buying what is already doing well. Also, professional investors such as fund managers, generally must pay attention to momentum. This is because their performance is measured against other fund managers and if they stay out of a rising share, it follows that their relative performance will suffer.
By their nature, investors that put much store by upward momentum, tend to be working short-term and for this very reason often employ technical tools to pick the stocks to invest in. Uppermost in such tools are charts that show the pattern of price movement over time and also the volumes being bought. Technical analyses of these patterns are used to plot future growth expectation.
A common expression in stock market parlance is “buy low, sell high”. In contrast, momentum investors buy high and sell higher. This is a very different approach to that of the Value Investor . It is, however, by no means the only alternative.
A third common strategy is known as Growth. This approach focuses on future rather than current profit. It implies that the investor is looking for capital gain rather than income and in particular a business with some or all of the following characteristics:-
A healthy Balance Sheet and generating profits already
A fairly simple business model that is easily understood
Operating in a market sector that is out of favour
Have a PE ratio that is at or near its annual growth rate and certainly not higher
Have a rate of growth that is accelerating
A company that does enjoy these qualities is likely to have shares that are already fairly highly priced (contrast this to the value approach) but because earnings are growing and not stable, there is seen to be potential for dramatic results in the short term and hence capital gain. We can elaborate on the characteristics to make this clearer.
A healthy Balance Sheet is akin to a healthy lifestyle, it gives the best chance of avoiding a damaging illness, namely a financial crisis. Investors have long since learned that complexity is a worry due mainly to the inability of management to keep too many balls in the air at any one time. Keep it simple, stick to the knitting. If the industrial sector is thought of as “whiz bang” or “cutting edge” or generally in vogue, the odds are that such a factor is already built into the share price and so diluting the prospect of short term gain. Similarly if, say, there is an annual growth rate (profit not sales) of 15% and the PE is already 16, then the price is getting too high to offer the prospect of much upside. Finally, we want to see acceleration, although we are not confident enough to be a Momentum investor.
We now turn briefly to another investment strategy, namely Income Investing. The income seeker is very close in approach to the value investor. It is high yield shares that are sought out since the investor is looking primarily for income and not capital gain. The attitude is conservatism but there will be some risk, otherwise the player would not touch shares at all but stick with instruments such as bonds and what are known as gilt edged securities.
The true income investor could well have a split personality in that he/she is closest to the “value” seeker who gets high yields and modest capital gains but at the same time will want to at least preserve their capital and so will look for measures that the “growth” investor users.
A further investment strategy that is an extreme version of value investing is known as Bottom Fishing. The approach is to buy the cheapest investments in term of valuation ratios. Bottom fishing can generate very good returns simply since low valuations mean there is much room for what is known as “re-rating”. However, there is usually a good reason why a share has a low valuation so that picking very cheap shares can be dangerous. Paradoxically, it may be less dangerous in the early part of 2008 than for many years.
There is an investment strategy that has not been touched on so far but has great relevance following the blood bath of the last six months, it goes by the title of contrarian. Going against current views is called contrarian investing and involves selling shares currently in vogue and buying those that are out of favour. Such investors attempt to spot shares that the market has failed to price correctly and then to go further by assuming that the opportunity to outperform arises simply because most other investors are wrong. As with bottom fishing, readers may recognise contrarians as at the extreme end of the value strategy. My pick of Taylor Wimpey (see below) might be thought of as contrarian bearing in mind the current state of the housing market. We shall see.
The case for switching investment strategies
Before describing further investment strategies, it is worth dwelling on a phenomenon that has undoubtedly been occurring since the start of 2008 with the advent of the so called “credit crunch”. This relates to a switch in strategy that has been enforced by the downturn in the market as a whole.
Momentum investors, and I include myself in this category, who are long-term and who do not “short” the market (this term will be explained later), have changed their approach since “momentum” has been largely downward. Instead they have adopted the Value approach, that is, instigated a search for companies with low valuations relative to current earnings but that are not low because the business is in trouble.
What the momentum investor is likely to have done since early January 08 is to get out of the market once the upward momentum ceased. Then to wait until they think the bottom, or somewhere near the bottom, of the cycle has been reached. At that time there will be many businesses with an exceptionally low PE ratio (ie much below 15) that ought to present good “value”. The result is not expected to be a dramatic gain in the short term but rather safety first and a good dividend return.
Since my personal investment strategy was that of Momentum and since such investors may have changed to seeking out Value as a safety first approach after the credit crunch downturn, I have been asked what approach I personally have taken. Whilst I am happy to answer this question with specifics, any share referred to must not be taken as a tip or generally as investment advice, it is merely my own approach and should serve to put flesh on the strategy bones.
The clouds heralding the present financial storm were gathering in the late summer of last year. In early September 07 (before setting out on my long annual walk) I “ran to cash”, that is, liquidated much of my portfolio of shares retaining only those that represented what I considered to be real “value”. The result was that my investment return in the 2007 calendar year as a whole was satisfactory. Within the last few weeks (February and March 2008) I have been buying back into the market adopting the Value strategy criteria. The shares I have actually bought are British Land, Diageo, Northumbrian Water and Vodafone. Each of these conforms to the criteria.
Whether the equity market has bottomed is the big question amongst the so-called experts. Opinions currently are pretty evenly split. But if it has, or if it nearly has, then there are many excellent businesses whose shares are priced at less than 50% of how they stood this time last year (March 07). For those tempted, my general advice is to go for the really big companies (FTSE 100) since they have global reach and at this time it seems best to still avoid any in the banking sector. The point is that such shares may well be attractive to the value strategy investor. During the Easter break, I did my own analysis and found 8 companies that qualify. Three of these companies are banks (RBS, Alliance and Leicester and HBOS) and in my judgement these are still best avoided at this turbulent time although they do fit squarely the criteria of low PE’s and high yields. Of the remaining 5, one is the retailer Kingfisher, another is Wolseley the large plumbing suppliers and a third is British Airways.
All these three seem to me far from bottoming out and therefore best avoided at this stage of the cycle. This narrowed the choice down to just two businesses and I have bought into both to add to the 4 value shares referred to last month. The first is Taylor Wimpey the construction group that had fallen by 61.6% over the past year and yields 9.6% and the second is Yell the media Yellow Pages business. Yell had fallen by a massive 76.1% (the greatest retreat of the whole list) and yields 11.1%. From a value standpoint, these shares are worth having due to their high return on the investment irrespective of any capital loss in the short term since the value investor is, by definition, a long-term player of the Stock Market. It follows that I now have 6 value shares in a portfolio that has switched from momentum as a strategy. Once I am convinced that the general decline in the market has ceased, the cash from last year will go back into the market. I will let readers know of the when and the what as it occurs.
Turbulence equals instability
We have learned that the valuations of companies that make up an index on the Stock Exchange is not stable. An indication of the turbulent times of late 2007 is evidenced by the magnitude of changes to the FTSE 100. At the quarterly revision on 24th December 2007, no less than 7 companies were demoted. This is the largest number of exits since September 2001 and is largely, but not solely, attributable to the so called “credit crunch”. Those relegated were, Northern Rock (bank), M&B (pubs), Punch Taverns (pubs), Barratt (builder), Tate & Lyle (sugar), DSG (electrical goods retailer) and Daily Mail (newspaper). The businesses promoted to the top flight were, Admiral (insurance), Cairn Energy (oil exploration), First Group (travel), G4S (security), Kelda (water), Thomas Cook (travel) and TUI (travel). Note the domination of travel in the ascendants. Is this escapism we might ask ourselves!
First posted by jgs in 2012